Cracking Business Case Interviews for Data Scientists — Part 2
Welcome back to “Part 2" of “Cracking Business Case Interviews for Data Scientists.” In this article, I will discuss the remaining parts of the 7 steps of a problem-solving approach. This article will cover:
(1) Step 4: Develop issue analysis and work plan — Use an issue analysis worksheet and a work plan to “plan” for actions
(2) Step 5: Conduct analyses — Sample analyses for simple cases (a toy example)
(3) Step 6: Synthesize findings — Build storyline pyramids (“Grouping” structure vs. “Argument” structure)
(4) Step 7: Develop recommendations — Convert a storyline pyramid to outline and final presentation
(5) Wrap-up: Key Takeaways
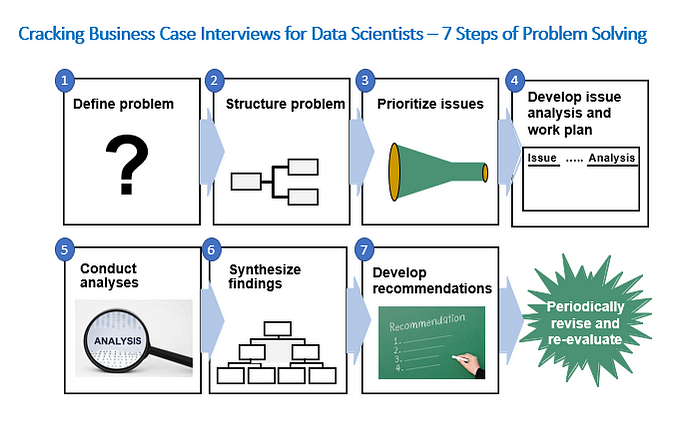
Step 4: Develop an issue analysis and work plan
Once we prioritize issues to analyze, we need to (1) design detailed analyses and (2) conduct proper work planning. Step 4 of the 7 steps of a problem-solving approach helps to plan for action. Figure 28 shows how an issue analysis and work planning helps to prepare for action.


Figure 29 shows “Tool #4A: Issue analysis worksheet.” This helps us to think through what analyses and activities you would need to prove or disprove hypotheses, which were generated and prioritized in Steps 2 and 3. In addition, we should write down potential data sources or data providers to clarify where we expect to obtain relevant data or information. Please note that relevant data or information can either be quantitative (e.g. transaction data tables in CRM database) or qualitative (e.g. focus group interviews with consumers, business stakeholder interviews). The description of “Analysis & Activity” in this stage does not have to be too detailed. It is better to be short and to the point.

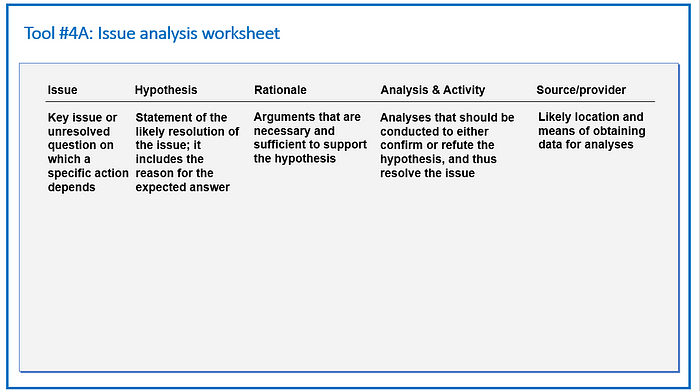
Figure 30 shows “Tool #4B: Work plan worksheet.” This helps us to specify end products (i.e. key deliverables) and assign responsibilities and deadlines for each key task. Note that a work plan worksheet (together with an issue analysis worksheet) is highly useful for data science managers to ensure that the sum of end deliverables will help the team to get to the answers that the team is trying to find out. Moreover, putting responsible owners and deadlines make expectations explicit among team members. It is important to develop this jointly with team members as a tool to build and reach consensus. Finally, I would recommend 2 practical tips: (1) Please avoid joint ownership of responsibilities. Assigning a key task to more than 2 people obscure who are responsible for the outcome. If you have to assign a key analysis or task to more than 2 people, you can still clarify lead and support roles. (2) For the timeline, please ensure that you have included some buffers. There will be unexpected events and data problems, which may delay the overall timeline (e.g. data quality issues, infrastructure problems, recruiting problems, availability of key stakeholders, etc.) Having buffers included in the initial work plan helps you to mitigate potential delays from unexpected problems.

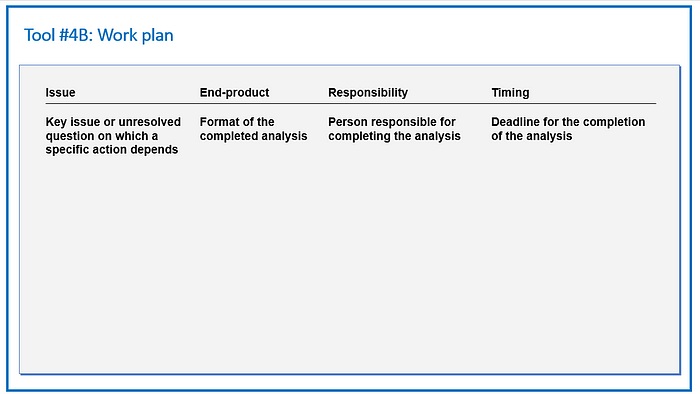
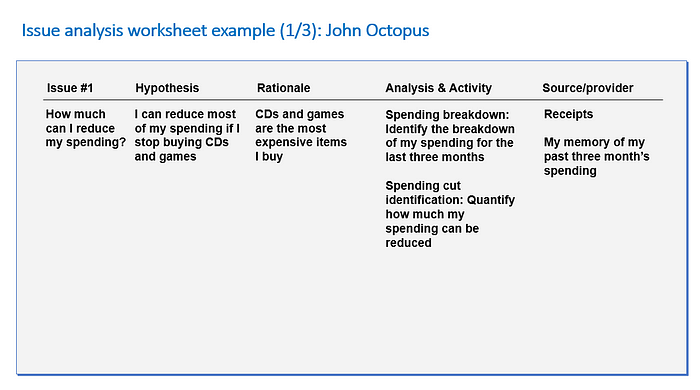
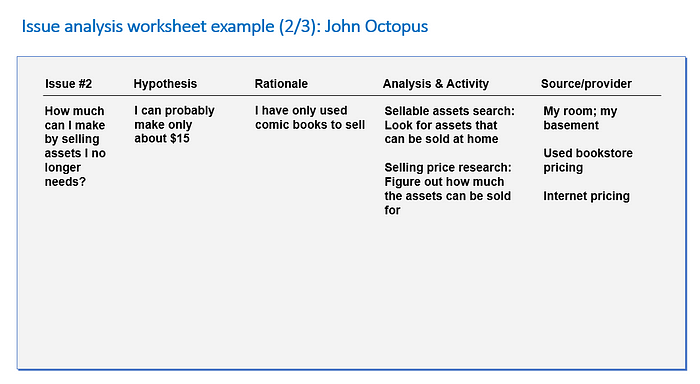
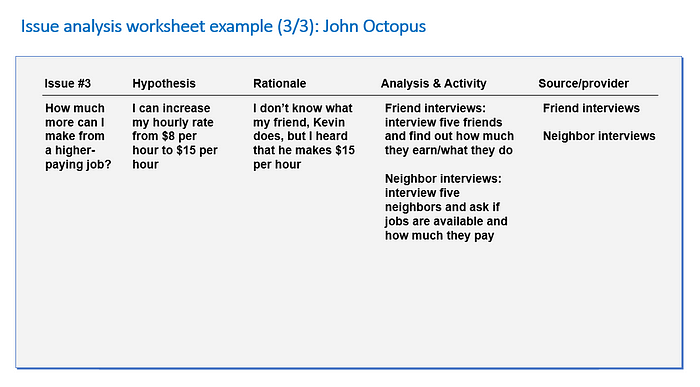
Figure 31 — Figure 33 show a simple example of “Issue analysis worksheet.” with a John Octopus example. Note that this step helps us to define separate work streams and identify relevant data and information providers.


Step 5: Conduct analyses
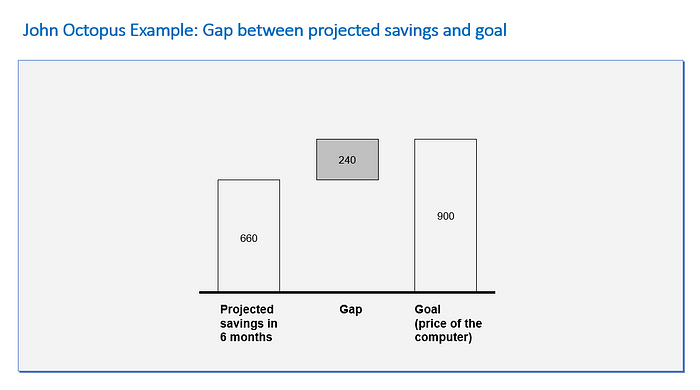
After key analyses and activities are defined in Step 4, you are finally at the stage to engage with actual analyses. This is the part, which can be very different by projects and problems. I will walk through a simple case example to showcase how this stage can evolve over time. For most of business problems, it is helpful to start with a baseline (a state without any actions taken) and goals. It is even better if you have agreed-upon metrics to measure these two states. If not, you may need extra works to clearly define the metrics to use and build consensus with the relevant stakeholders. For the John Octopus example, we can start with the assessment of the current state. A “waterfall chart” is quite useful to visually show both the baseline and the goal, together with a gap to close. Figure 34 shows baseline, gap, and goal for the John Octopus example. To buy a MacBook Pro computer, which costs $900, John Octopus needs to close a gap of $240.

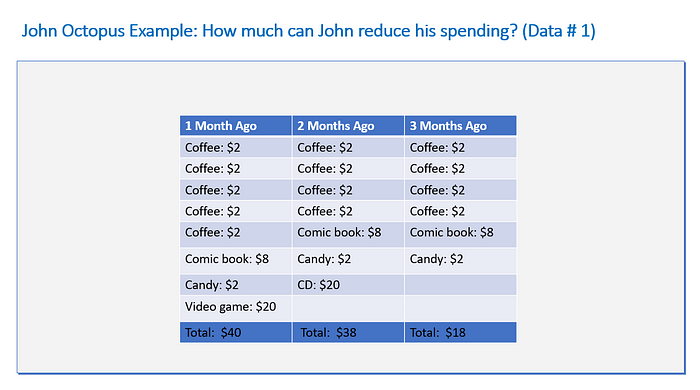
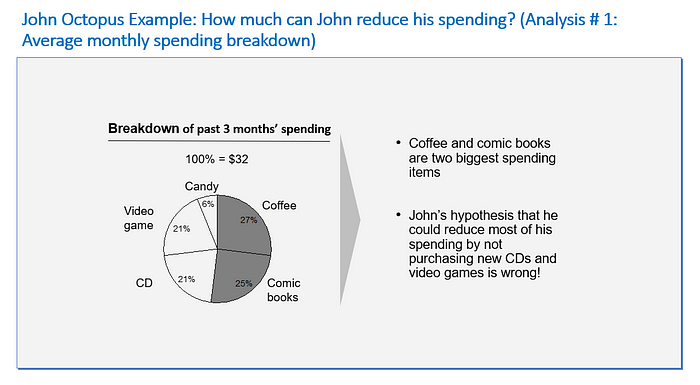
The first analysis of the impact of reduced spending is shown in Figure 35. It is often important to collect data across multiple time periods since there can be seasonality or trends in the data. The table of monthly spending data in Figure 35 indeed shows the fluctuation of spending over time. Using the average across 3 months ($32) will be more robust estimates of average monthly spending compared to an estimate from 1 single month. The breakdown of average monthly spending in Figure 36 disproves the initial hypothesis. Coffee and comic books are 2 largest spending items, instead of video games and CDs. Let me emphasize that the initial hypothesis does not have to be correct. Data and analysis in this stage will prove or disprove a hypothesis, which is a helpful device to focus analyses.


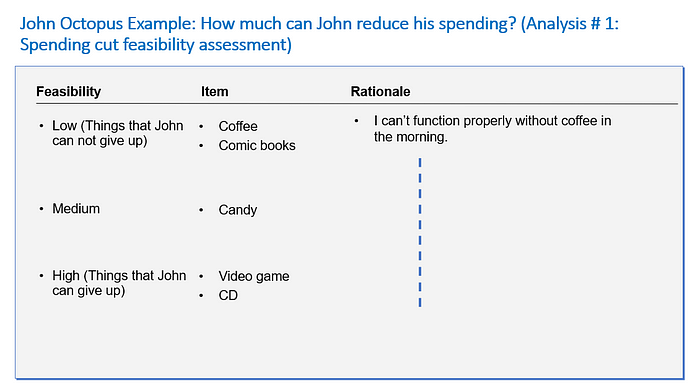
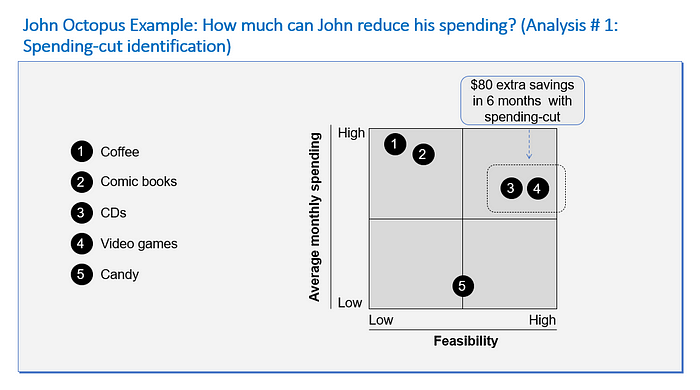
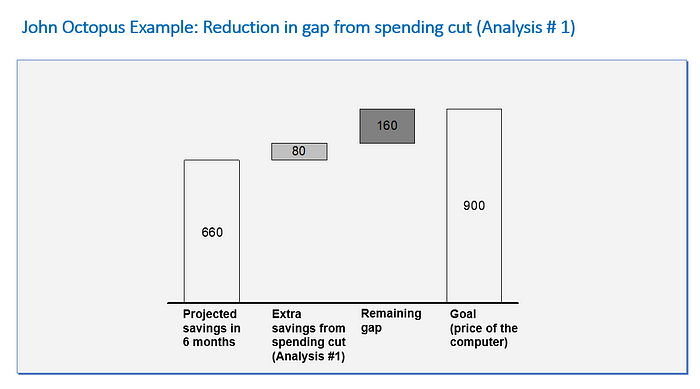
It is one thing to find out which items are the highest spending items, but you also need to think through the feasibility of reducing that spending. Figure 37 shows an example of qualitative spending cut feasibility assessment. As an example, John Octopus decides not to cut coffee spending since he cannot function properly without coffee in the morning. Based on average monthly spending (i.e. impact on reduced spending) by items in Figure 36 with the feasibility of spending cut in Figure 37 (assessed by High/Medium/Low), we can create a “prioritization” matrix in Figure 38. This shows that video games and CDs are items that John can reduce spending without too many difficulties. We can reflect the result from this analysis and assess how much of the gaps we closed. Figure 39 shows that the spending cut on video games and CDs can contribute $80 in the next 6 months, which reduces the gap to $160.


As a second analysis, John Octopus assessed how much he can make by selling unnecessary assets such as used comic books. Figure 40 summarizes the results from this analysis, which identifies $50 extra savings from selling unnecessary assets. Figure 41 revisits the gaps from the goal after adding this extra saving. With the addition of $50, the remaining gap is now reduced to $110. Please note that quantifying the impact from each analysis and comparing it against the goal helps you to tell when you can stop. If the overall impact is large enough to achieve your goal, you can stop earlier instead of doing all the activities or analyses.


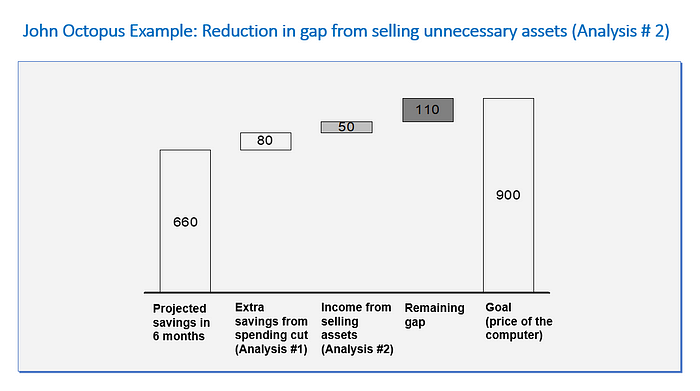
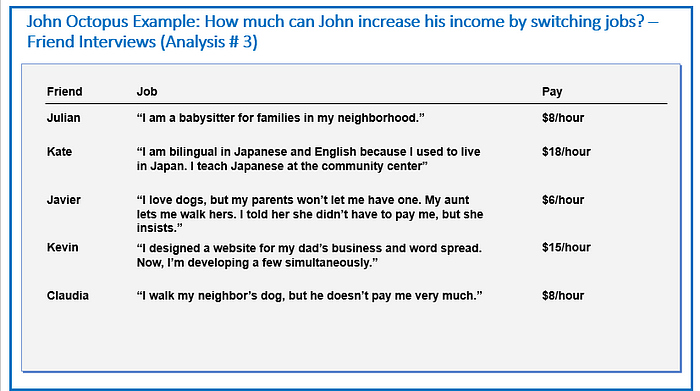
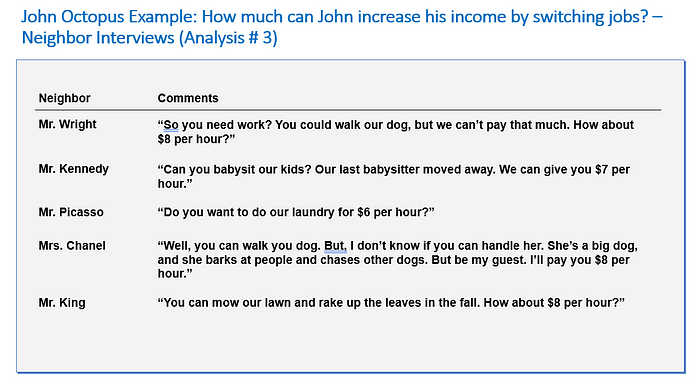
Figure 42 and Figure 43 summarize the findings from analysis #3 — friend and neighbor interviews: how much can John increase his income by switching his job. After going through his findings, John realizes that he can only make $6 — $8/hour. Figure 44 summarized his findings. The hypothesis of increasing his income by switching a job does not seem to work. Are we stuck here? How can we close the remaining gap?


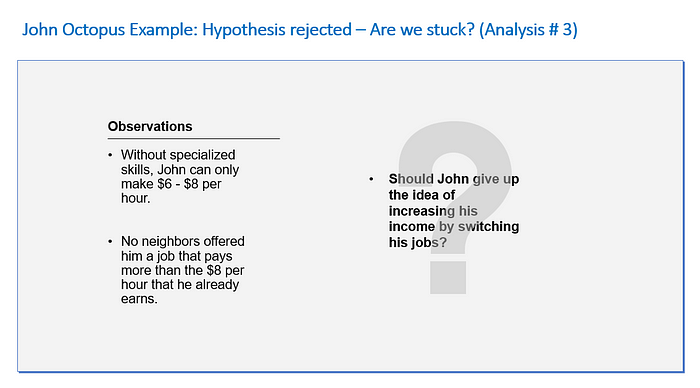
This is where multiple iterations start to happen. Sometimes, the sets of initial hypotheses may not be enough to achieve your goal. We need to think about other possible ideas. Oftentimes, the data and analyses conducted up to now provide foundations for new ideas. Figure 45 shows a sample output from this process. John Octopus realizes that he can walk more than one dog at the same time. This can increase his monthly earning by $32 without putting in more hours. After reflecting this increase in his monthly income, Figure 46 shows that he can now afford a $982 computer, which is exceeding his goal of $900. A problem is solved!


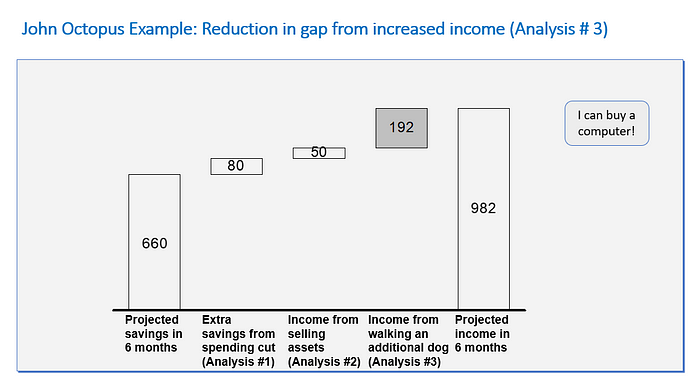
Figure 47 summarizes a few tips that can be useful in the step of “conducting analyses.” Let me emphasize again the importance of having multiple iterations. It is better to iterate fast and efficiently multiple times instead of trying to be perfect and through with a slow speed. a fast fail is more than encouraged and you can always iterate multiple times to improve.


Step 6: Synthesize findings
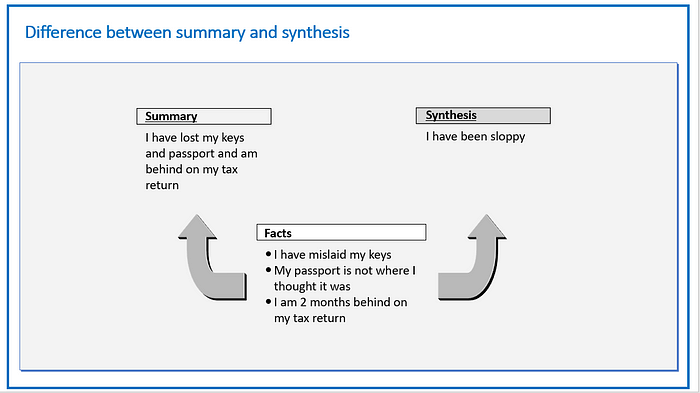
Once you finished your analyses in Step 5, Step 6 is an important beginning step for communication: “Synthesize findings”. Note that synthesis is not the same as summarization. Figure 48 contrasts how synthesis is different from summary based on the same underlying facts. Synthesis tends to focus more on “so what?”

The pyramid principle (Barbara Minto) helps to synthesize underlying facts. Figure 49 shows how the process of synthesis is different from communication. Synthesis is usually bottom-up. Starting from underlying facts, data, and analyses, grouping helps to find a pattern or similarity. By asking “so what”, you can eventually synthesize these into governing thought. In contrast, communication is usually happening in a top-down way.

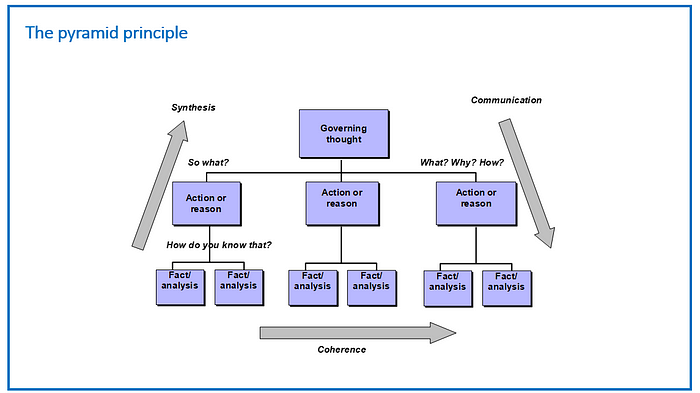
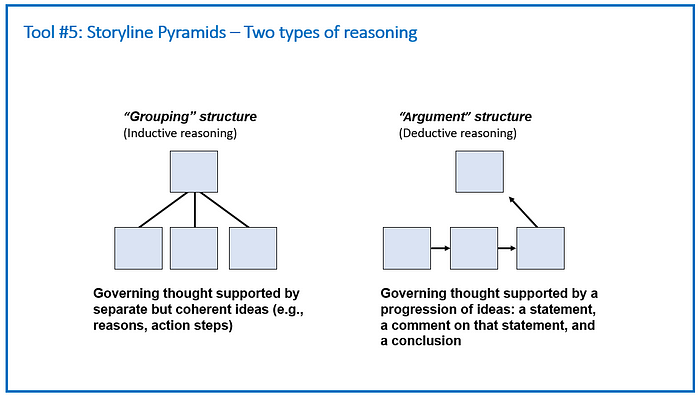
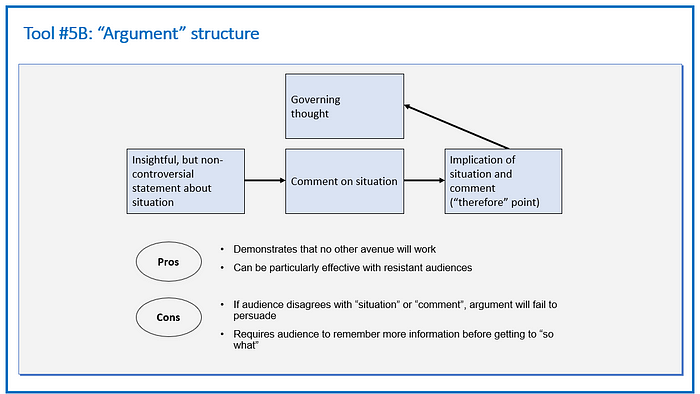
Figure 50 introduces “Tool #5: storyline pyramids.” You can have a “grouping” structure, where a governing thought is supported by separate but coherent ideas. Another alternative is an “argument” structure, where governing thought is supported by a progression of ideas. Figure 51 and Figure 52 provide more details on these two logical structures with pros and cons.


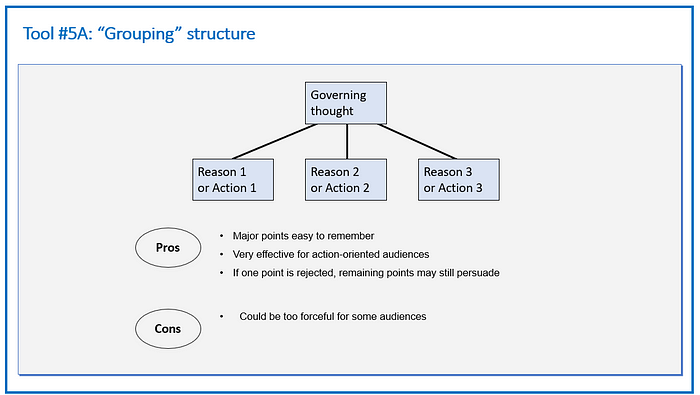

To make these more concrete, Figure 53 and Figure 54 provide examples of a “grouping” structure. A “grouping” structure works well for the action-oriented audience. Another main benefit is that if one point is rejected, the remaining points are still valid. However, this can be perceived as too forceful for a certain audience.

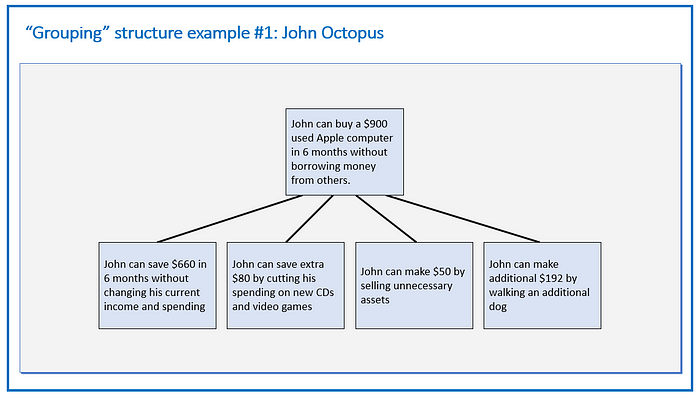

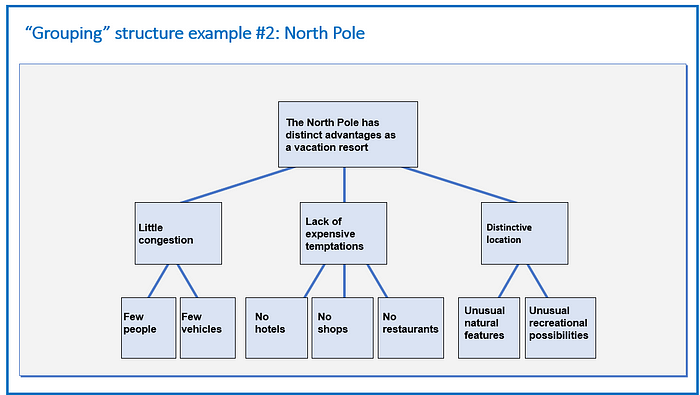
Figure 55 provides an example of an “argument” structure. This can be effective for the resistant audience. However, if the audience disagrees with the situation or comment, the argument can fail to persuade.

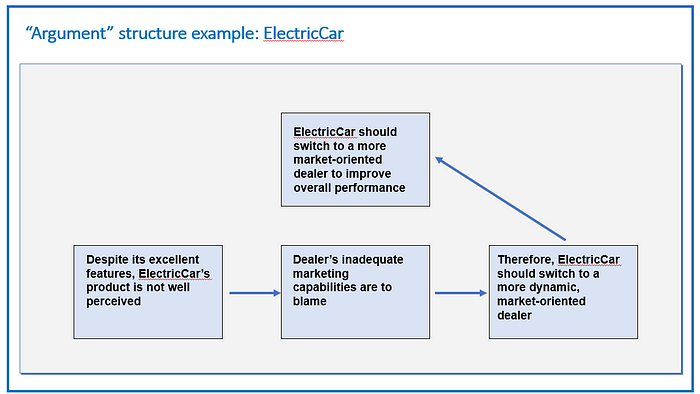
Figure 56 provides a few useful tips for synthesis. Organization and structure are keys to making a solid storyline. It pays off to keep the message focused. Digression should be avoided even when you have interesting facts from your analyses if those are not related to the key issues.


Step 7: Develop recommendations
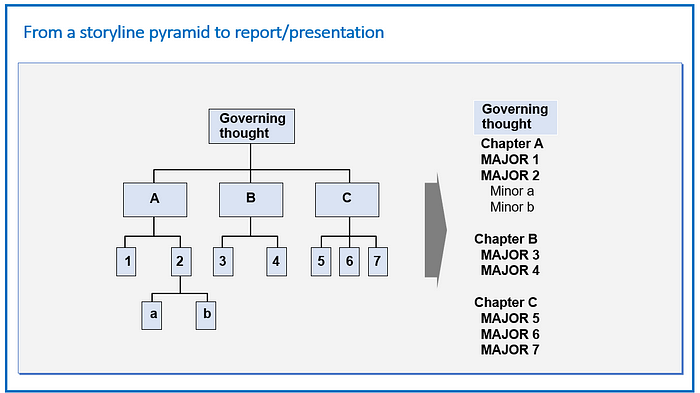
Once you develop a “storyline” in step 6, the final step of the 7 step problem-solving approach is “developing recommendations.” Let me emphasize the importance of final communication in this stage. Sometimes, very sold analyses and compelling data fail to make business impacts because of the lack of compelling communication. In some cases, effective communicators can succeed to persuade the audience even with less compelling data and analyses. Figure 57 shows how a storyline pyramid that you developed in Step 6 can translate to the outline for the final report or presentation.

One of the popular ways to tell the story is SCR: situation, complication, resolution. This approach is quite effective, especially with a more resistant audience. Moreover, eastern culture audiences tend to favor this way of storytelling (i.e. building up). In contrast, western culture audiences prefer a “top-down” way of storytelling in general. More senior leadership audiences tend to prefer a “top-down” way of storytelling. However, these depend a lot on the specific audience and situations. Figure 58 (Tool #6) shows details on SCR.

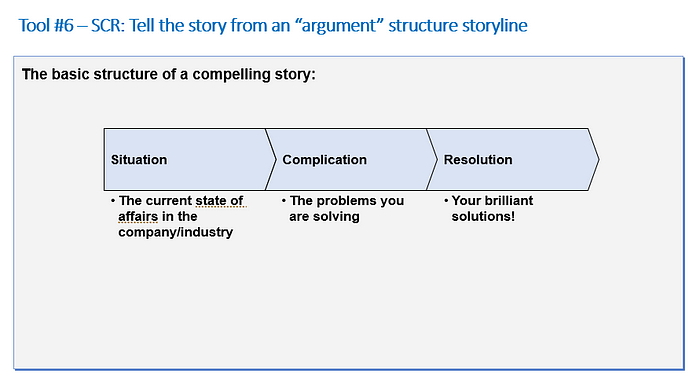
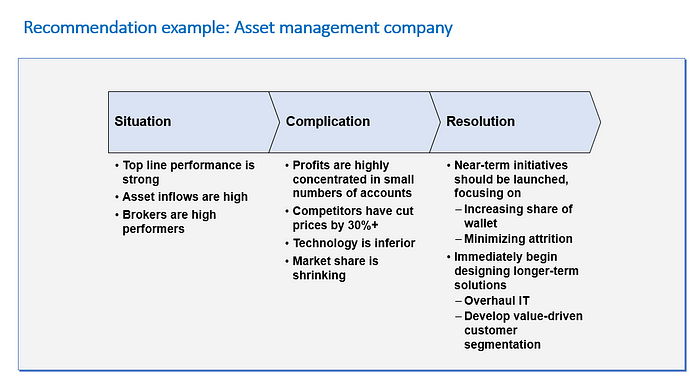
Figure 59 provides an asset management company example of storytelling based on situation, complication, and resolution. The buy-ins for the situation and complication are critical for the audience to accept the recommendation in resolution.

Wrap-up: Key takeaways
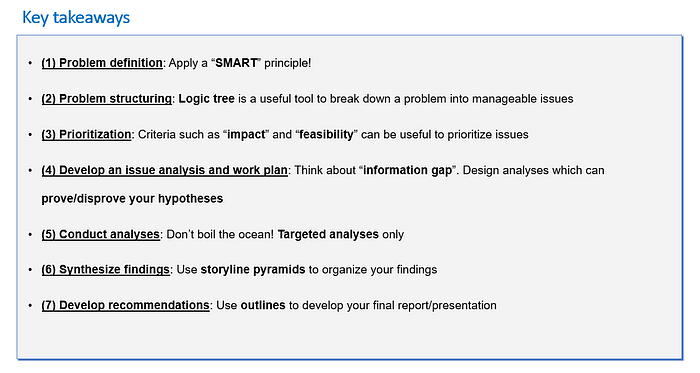
I have introduced a 7 step problem-solving approach, which can be used for business problems and data science problems (especially decision science problems or more application-oriented data science problems.) Hope you find this structured problem-solving approach useful to (1) prepare for business case interviews for data scientists and (2) handle day-to-day activities and tasks as data scientists. In Figure 60, key takeaways are summarized for each step of the 7 step problem-solving approach.

*John Octopus example in this article is adapted from “Problem Solving 101: A Simple Book for Smart People” book by Ken Watanabe.
Disclaimer: I am not representing McKinsey for the suggested problem-solving approach, which is described here. I am just sharing my opinion.
Reference
- The Pyramid Principle: Logic in Writing and Thinking, ISBN-13: 978–0273710516, Barbara Minto
- Problem Solving 101: A Simple Book for Smart People, ISBN-13: 978–1591842422, Ken Watanabe


Data Science Training in Noida
ReplyDeleteData Science Course in Noida
Data Science Training in Noida
ReplyDeleteBlinds feel neat and organized. curtains and window coverings
ReplyDelete